Provides detailed information on performance and capacity from NetApp storage devices to PRTG network monitoring
key features
|
{tab Benefits}
Benefits
|
{tab Features}
|
Features |
|||
NetApp CPU Usage |
NetApp Hardware Health |
Aggregate Operations |
Volume Operations |
| CPU load of a NetApp is an important metric to monitor, but we dont stop there. NetApp plugin can monitor all the individual CPUs in a multi-processor system, track consistency point and interrupt activity, and lets you correlate whether the CPU load is impacting your request latency, or not. | This is the primary metric for every NetApp administrator – NetApps are meant to service read and write requests, and NetApp plugin lets you track exactly how long those request take, trend them over time, and alert you if there are any issues. It even accommodates the different units reported by different versions of OnTap. | NetApp Plugin detects all aggregates, what volumes are on them, and constructs overview graphs, showing at a glance which volumes are utilizing resources, and whether they are impacting performance of other volumes. |
Need to investigate details of a volume’s performance? It’s easy to see the operations on individual volumes over time with NetApp Plugin. |
|
Performance
|
|
|
| click to live demo | |||
{tab Advanced features}
Advanced features
You can monitor values from any counter within the NetApp Performance API context and Filter out the data you want to present
Many Predefined Performance and Capacity Views built-in for you...
Predefined views of best-practice based set of counters
...Or create your own Performance Views
Design your own views based on best practices or your own taste.
{tab Customizing}
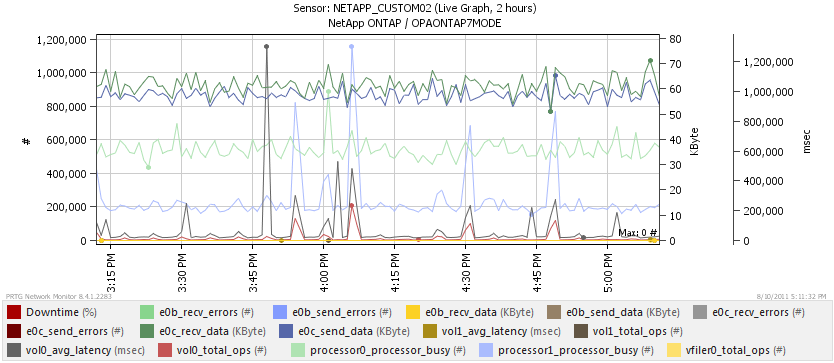
Custom Query example of one iscsi instance with moderated counter values
{tab All Sensors}
All Available Sensors Listed
{include_content_item 39}
{/tabs}
{include_content_item 99}
| Disks Failed | 0 # |
| Disks Reconst | 0 # |
| Disks ReconstPar | 0 # |
| Disks Scrubbing | 0 # |
| Disks Spare | 40 # |
| Disks Total |


